Usage
actsense audits a repository, a single action, or a workflow you paste in. It maps everything that workflow runs, audits each piece at the version it runs, and puts every finding on the node and line it came from. This page follows one audit from start to finish.
step-security/github-actions-goat, and follow your light or dark theme.Start an audit
Open actsense (http://localhost:8000 with Docker, http://localhost:5173 in development) and type what you want audited.
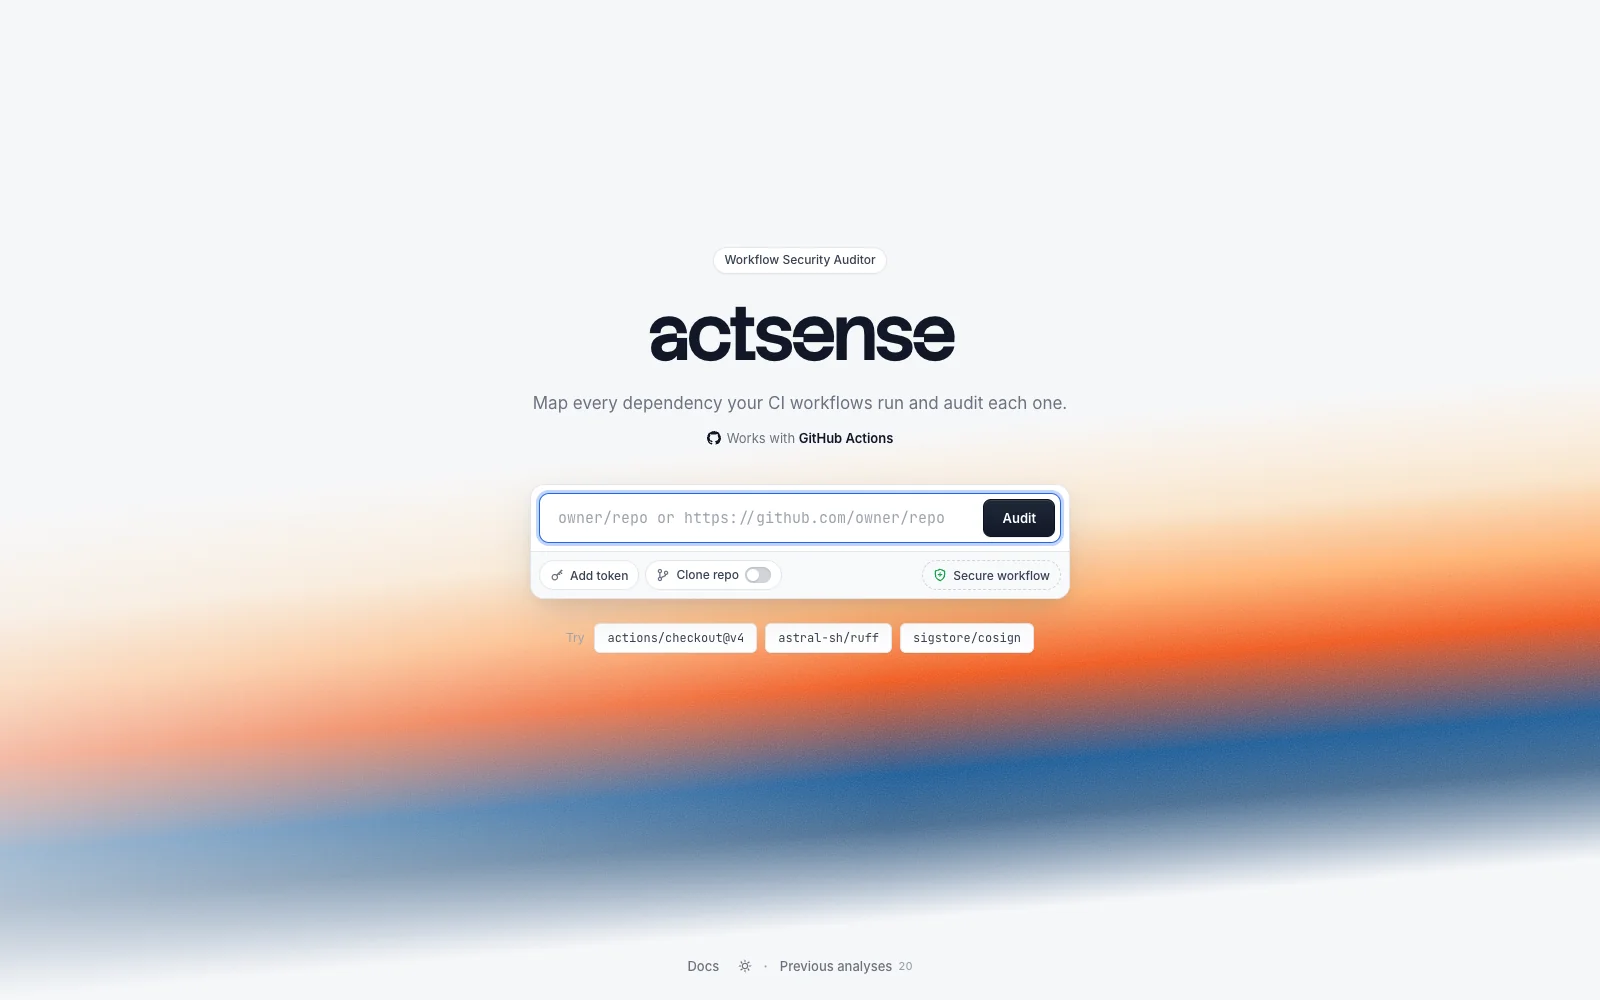
| You enter | actsense audits |
|---|---|
owner/repohttps://github.com/owner/repo | Every workflow in .github/workflows, plus the actions, reusable workflows and images they use |
owner/repo@refactions/checkout@v4 | That one action at that ref, plus its own dependencies |
| Secure workflow | A workflow you paste in. See Fix a workflow |
The two options below the input:
Raises the GitHub API limit from 60 to 5,000 requests an hour, which deep graphs need. A token with no scopes is enough for public repositories. It is sent with the audit and never saved.
Reads workflows from a git clone instead of the API. Use it for private repositories or to spend fewer API calls. Available for repositories, not single actions.
Each audit is saved. Open Previous analyses at the bottom of the screen and choose Load to reopen one without running it again.
Read the results
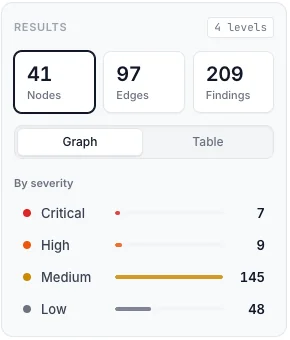
When the audit finishes, the sidebar shows a summary. Every part of it is also a filter.
- Nodes
- The full graph. Select it to clear any other filter.
- Edges
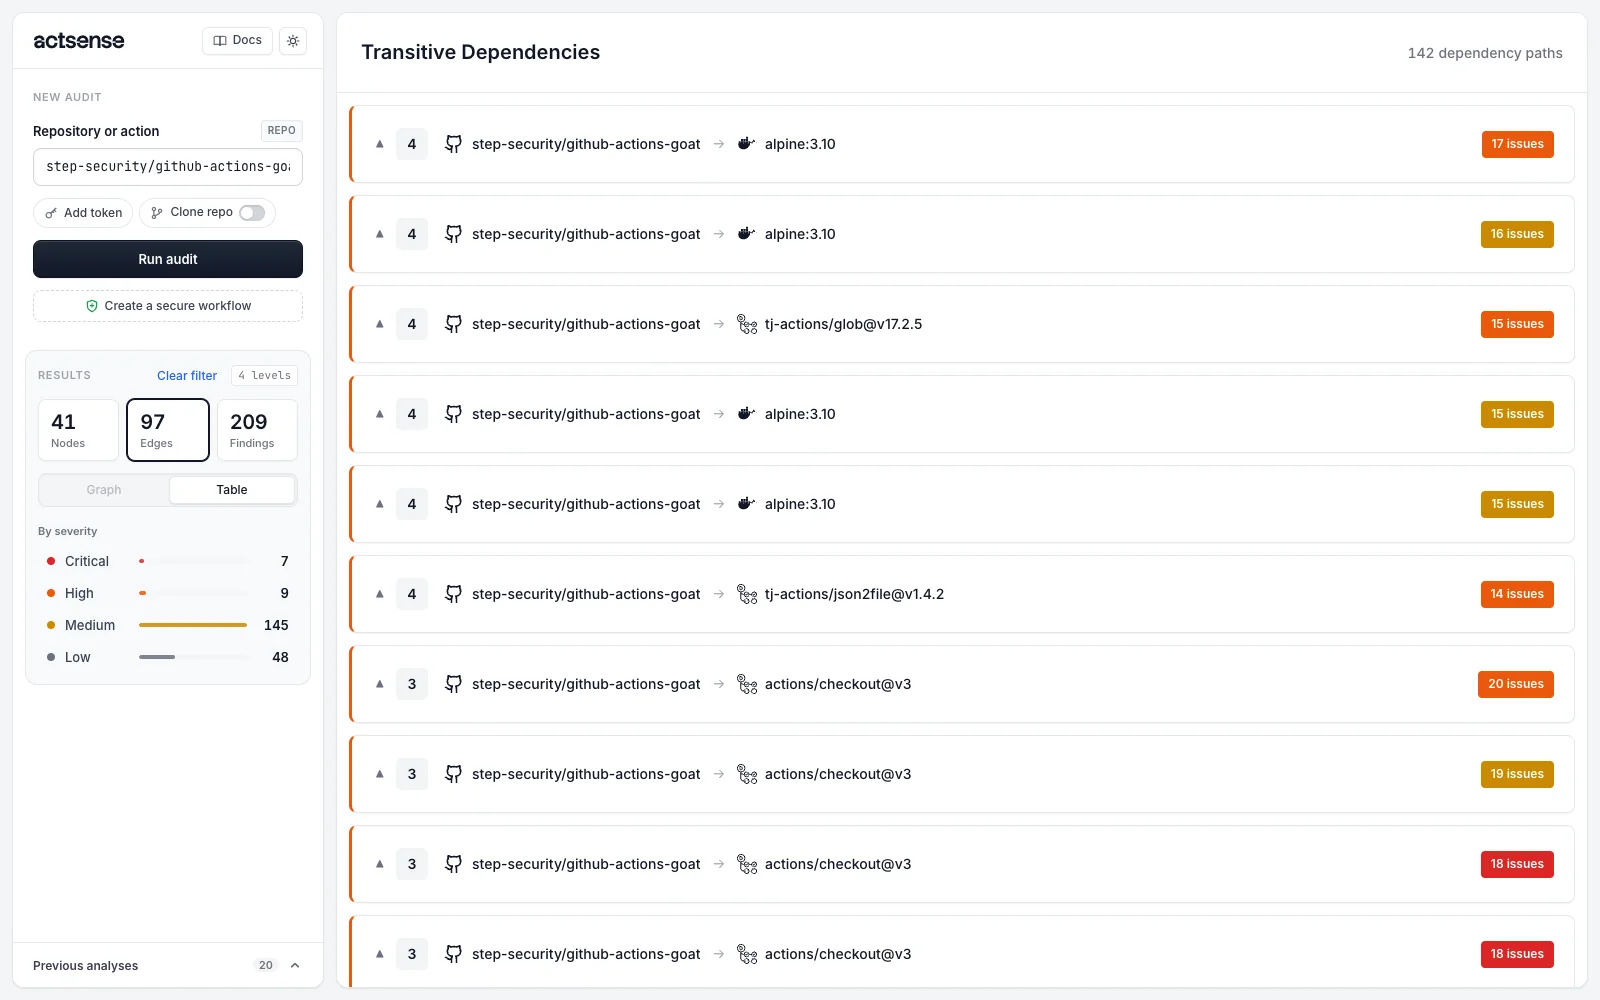
- Every dependency path from the repository, as a table.
- Findings
- Every finding, sorted by severity, as a table.
- Graph / Table
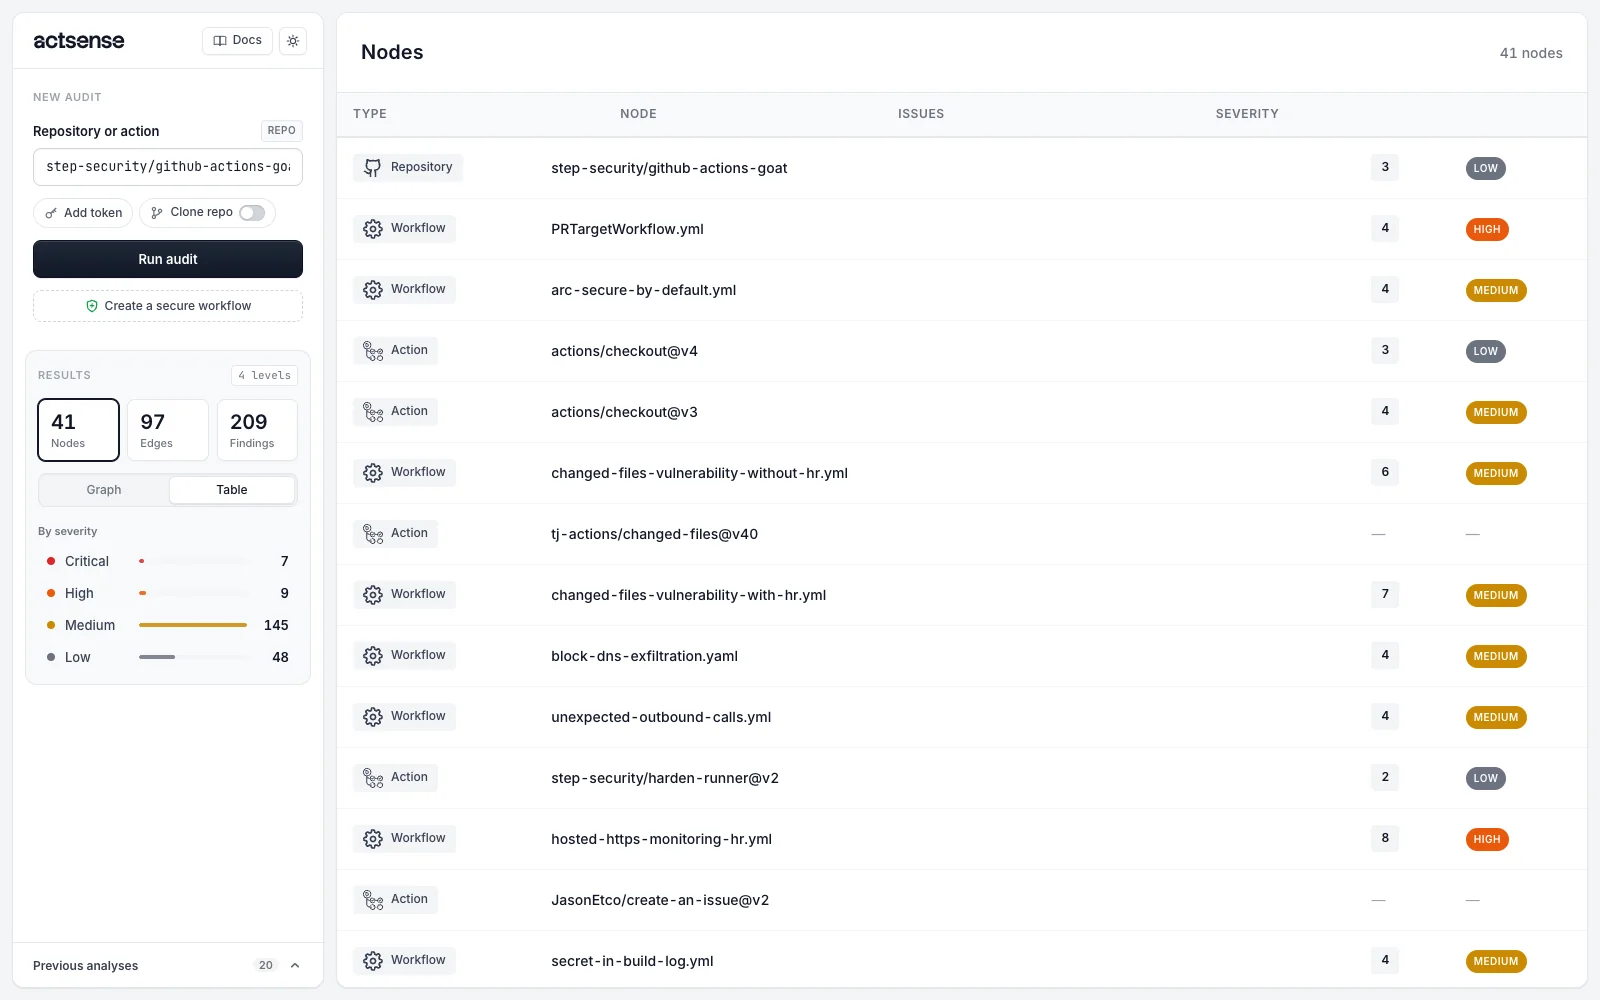
- Switches the current view between the graph and a list of nodes.
- By severity
- Select a row to show only nodes with findings at that severity. Select it again, or Clear filter, to go back.
- Levels
- How deep the graph goes. Resolution stops at 10 levels, the same nesting limit GitHub puts on reusable workflows.
Severities tell you what to fix first:
| Severity | Meaning |
|---|---|
| Critical | Exploitable now, for example a pull_request_target workflow that runs a fork’s code with your secrets. |
| High | A serious weakness an attacker can build on, such as a write-all token or an unpinned third-party action. |
| Medium | Hardening you should schedule, such as tag pins instead of commit SHAs. |
| Low | Best practice and hygiene. |
Explore the graph
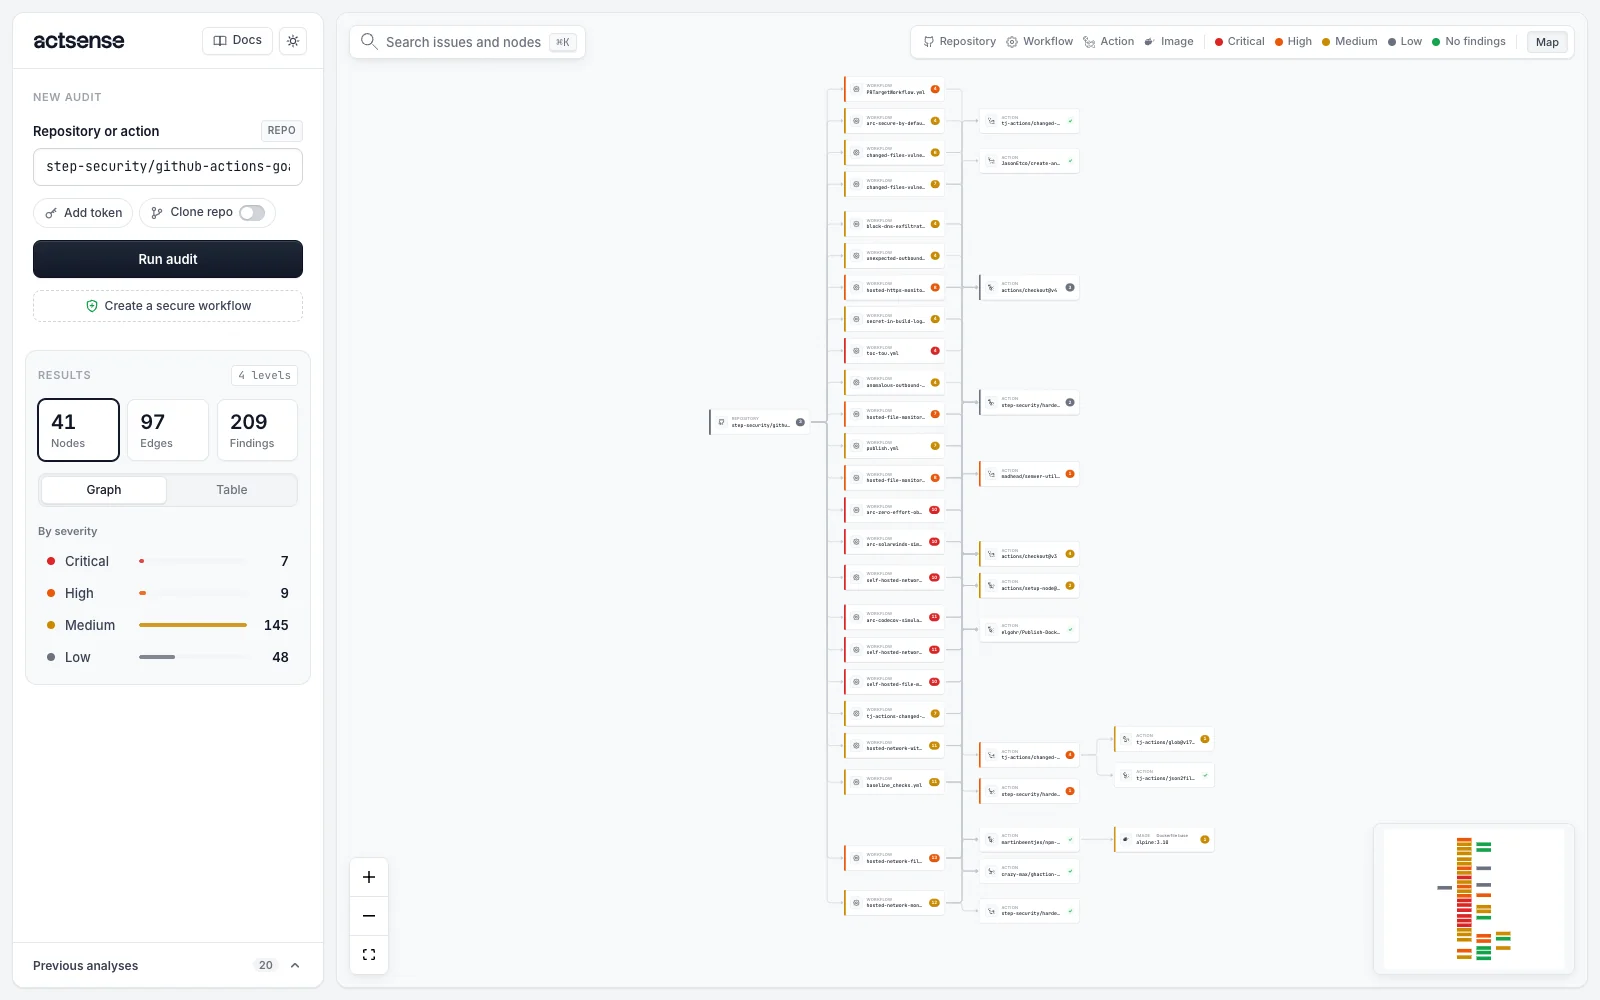
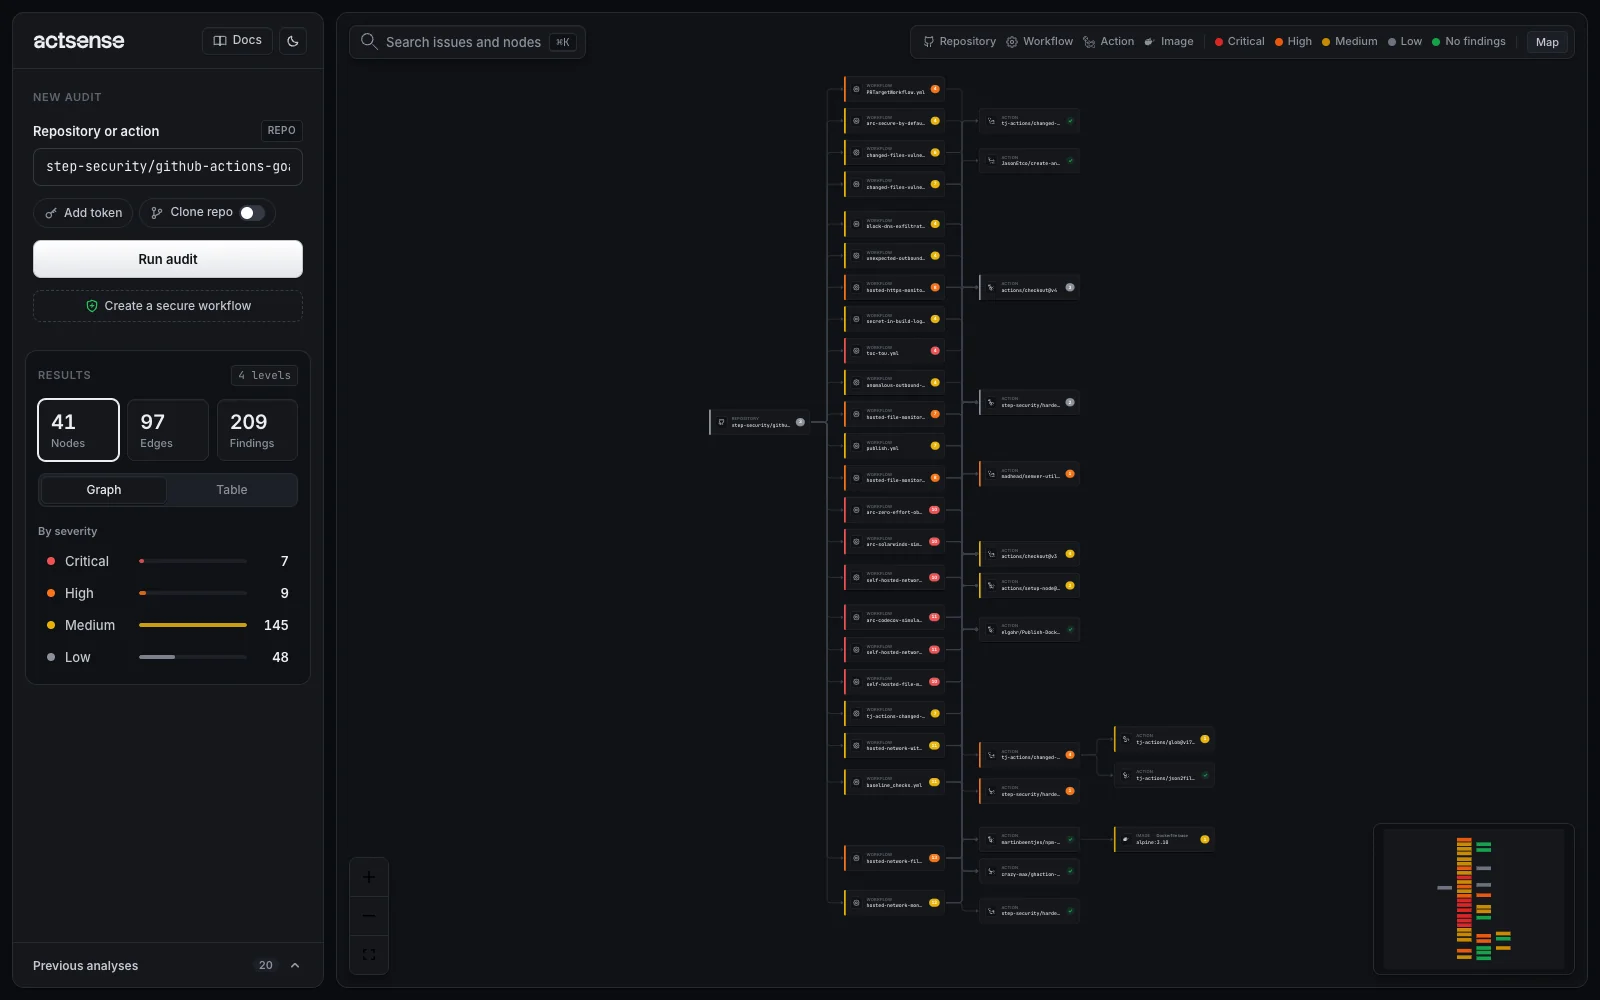
The graph reads left to right: the repository, its workflows, then the actions, reusable workflows and container images each one uses, down to their own dependencies. An edge means the left node directly references the right one, at the ref the workflow pins.
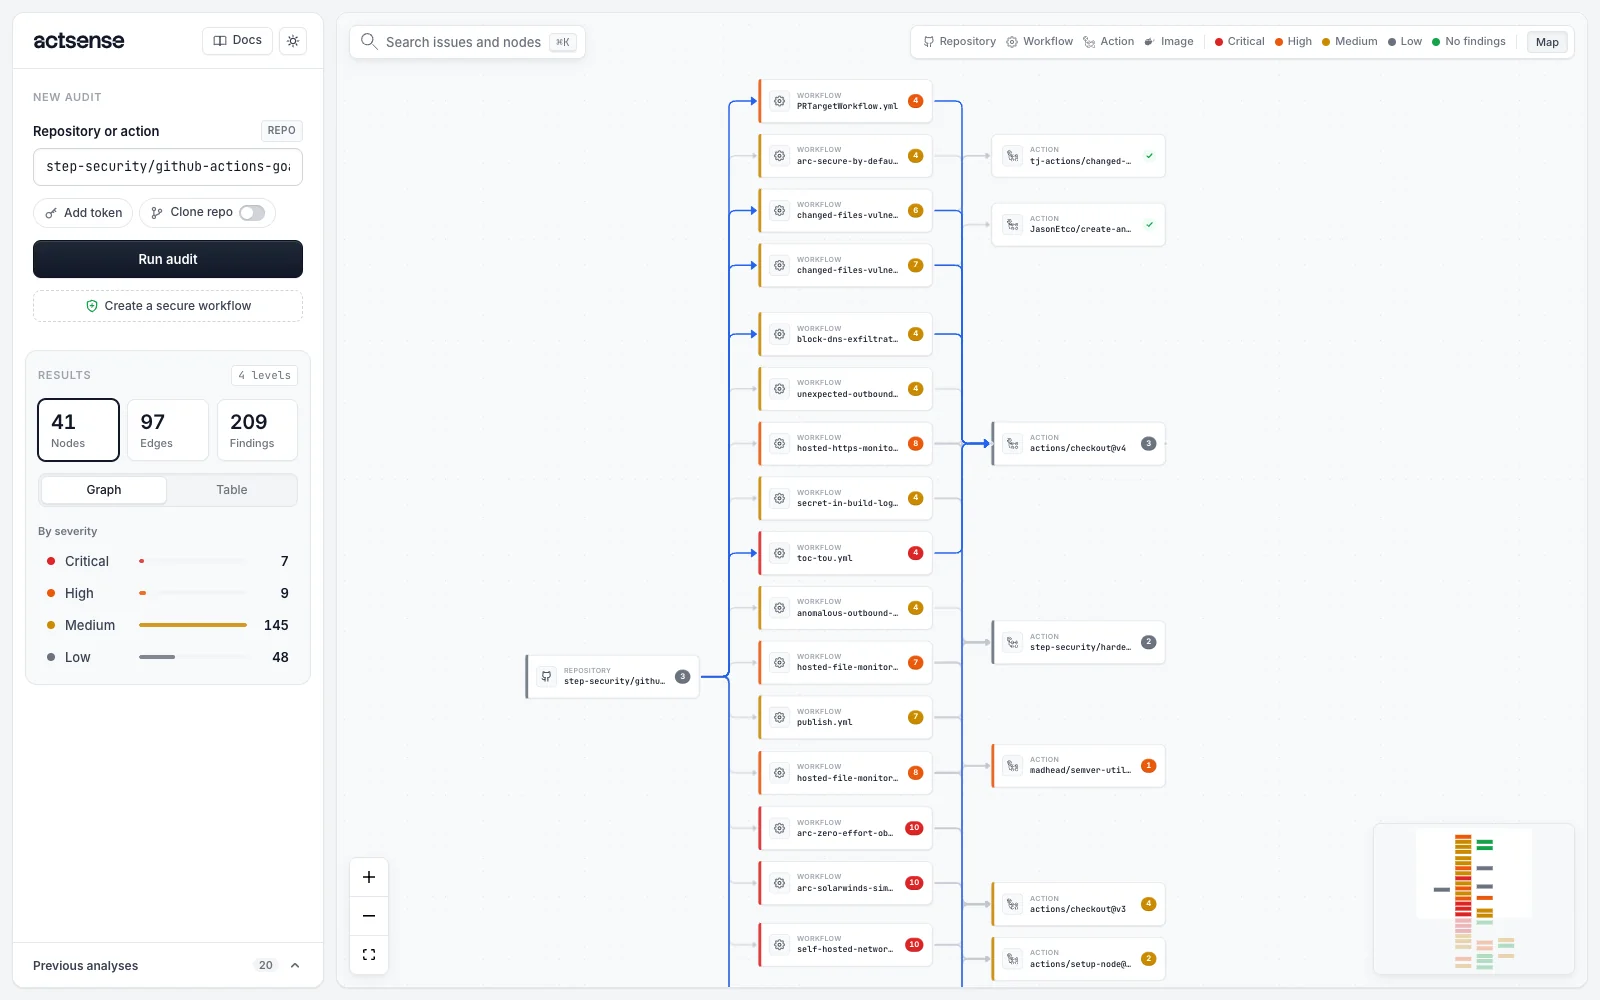
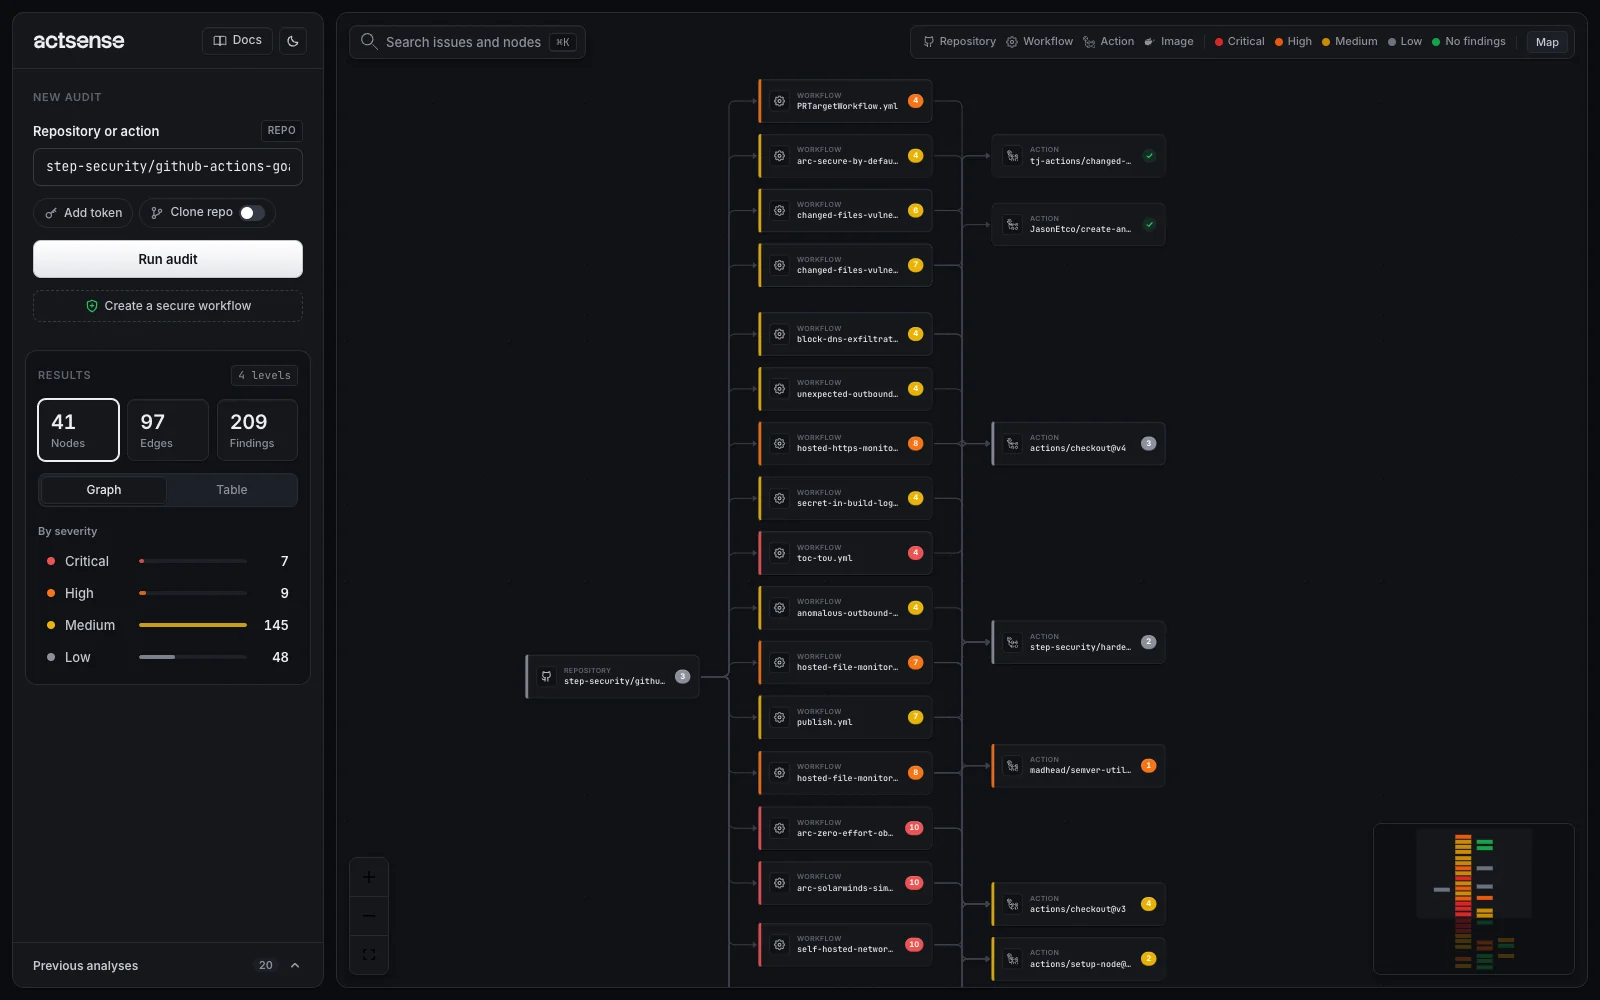
actions/checkout@v4 highlights every workflow that uses it.- Nodes show their type, name and finding count. The badge colour is the node’s highest severity. A green check means no findings.
- Hover a node to highlight its lineage: everything it depends on and everything that depends on it.
- The legend at the top names the node types and severity colours. Map turns the minimap on or off.
- Zoom with the controls at the bottom left. The last control fits the whole graph back on screen.
Inspect a node
Click a node to open its details panel.
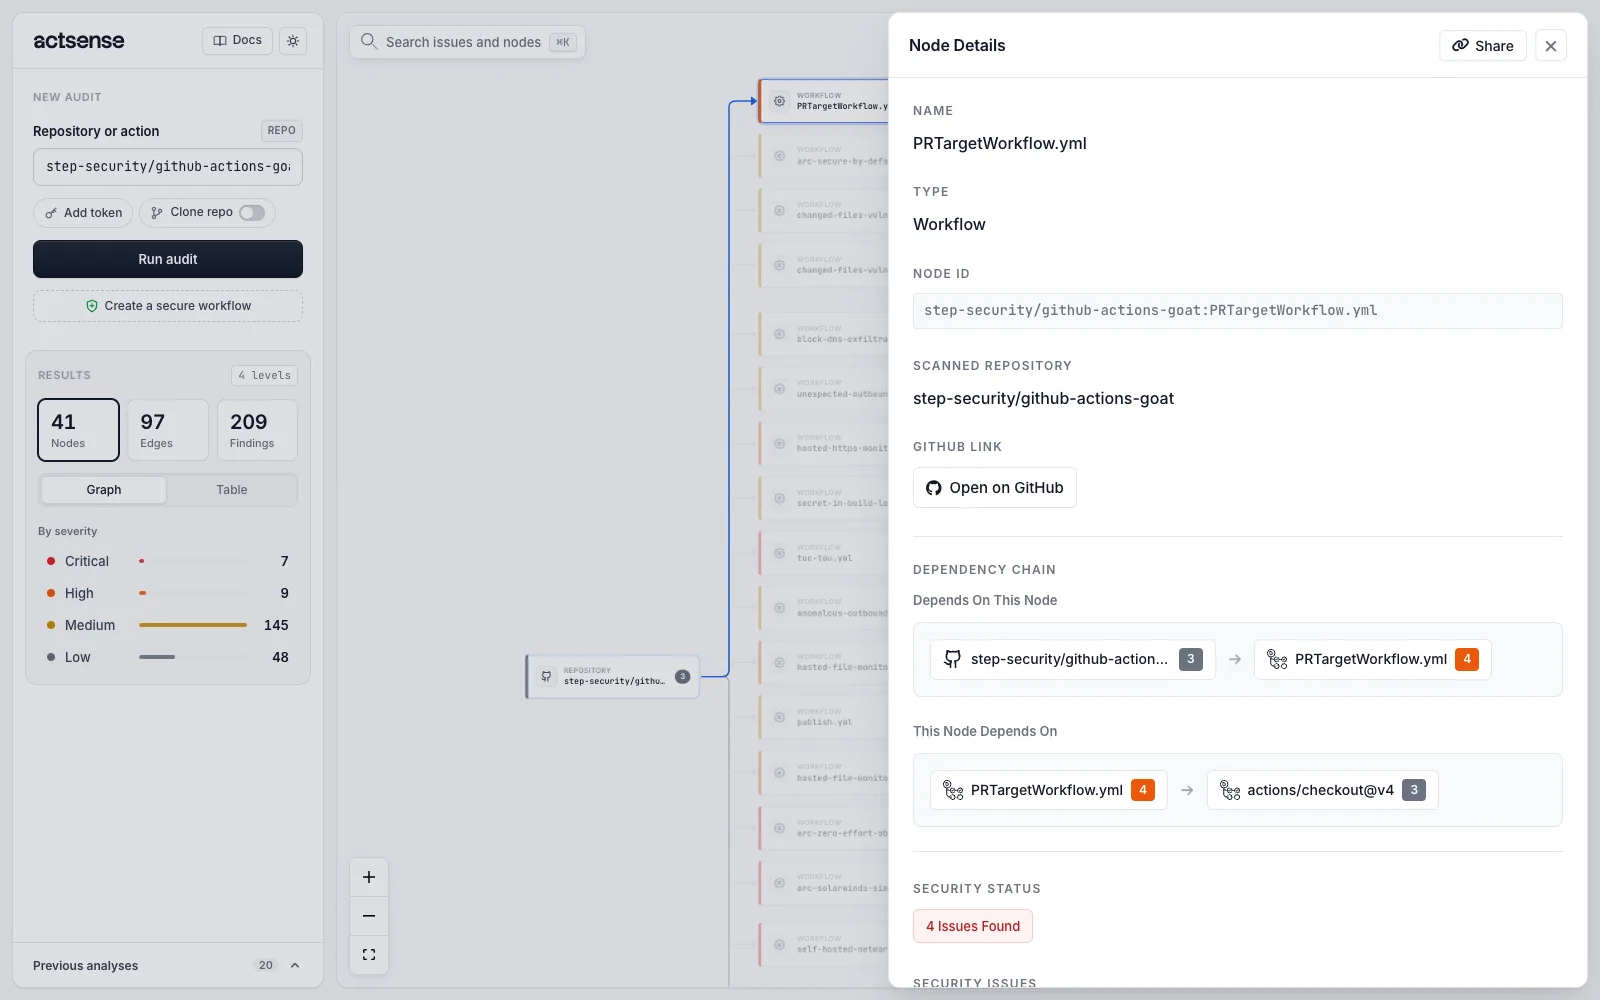
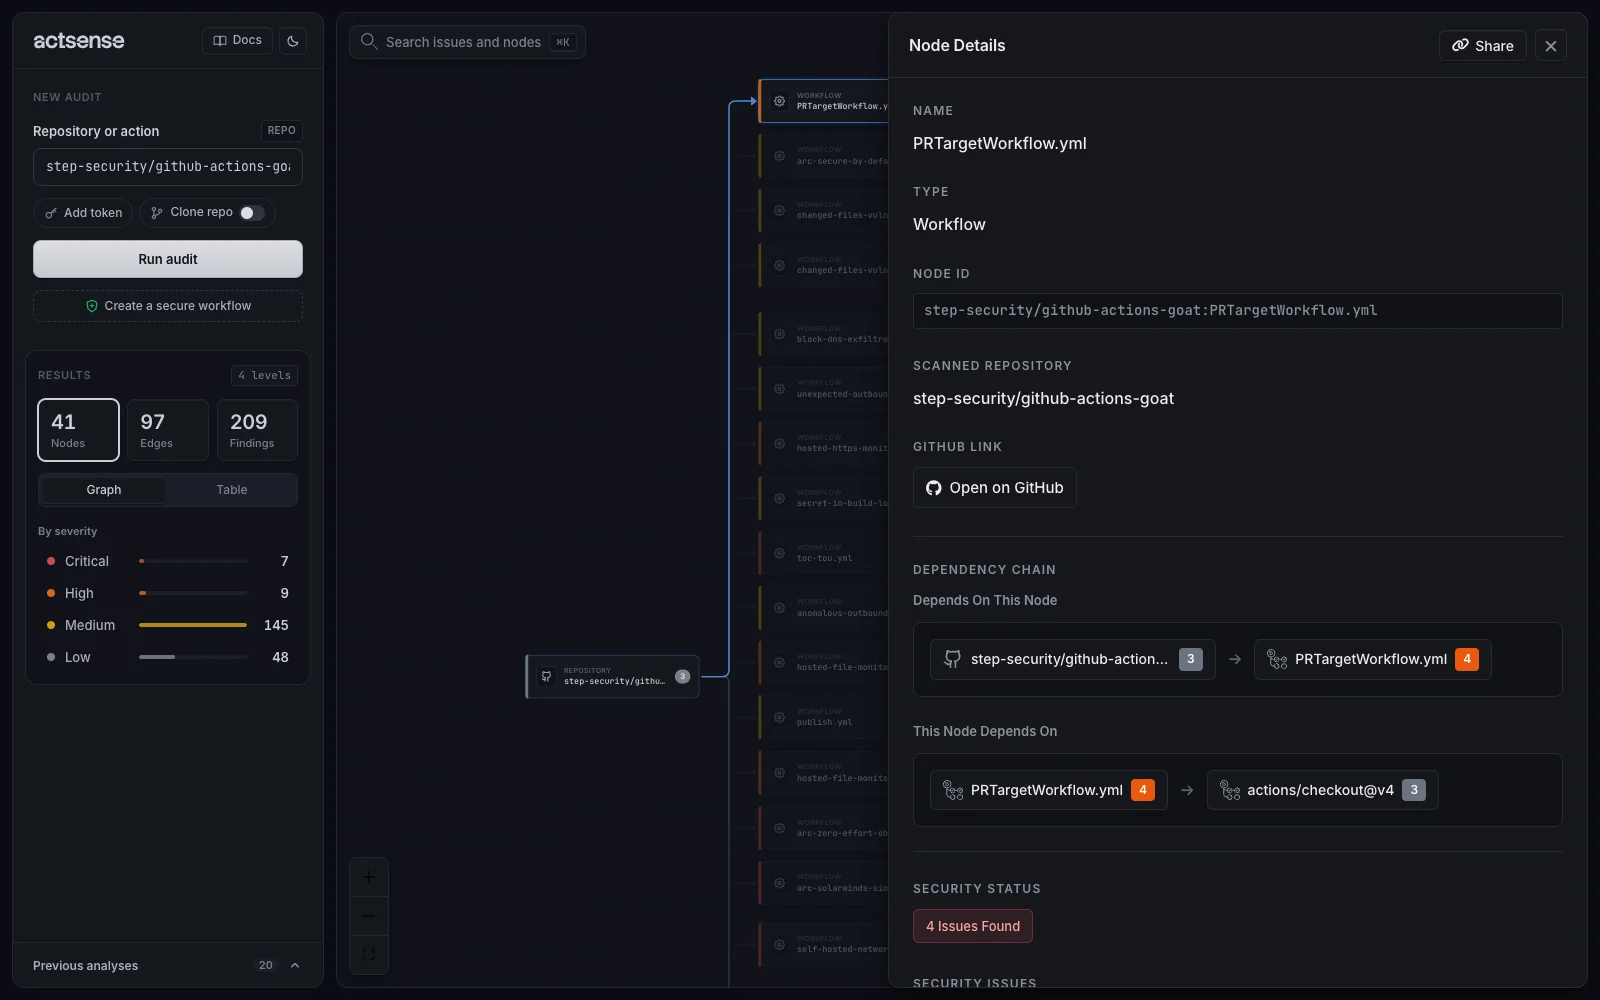
PRTargetWorkflow.yml.The panel shows:
- Name, type and node ID, plus the repository that was scanned.
- Open on GitHub, linking to the file at the audited ref.
- Dependency chain: what depends on this node, and what this node depends on. Click any chip to jump to that node.
- Security issues: every finding on this node. Click one to open it.
Finding details
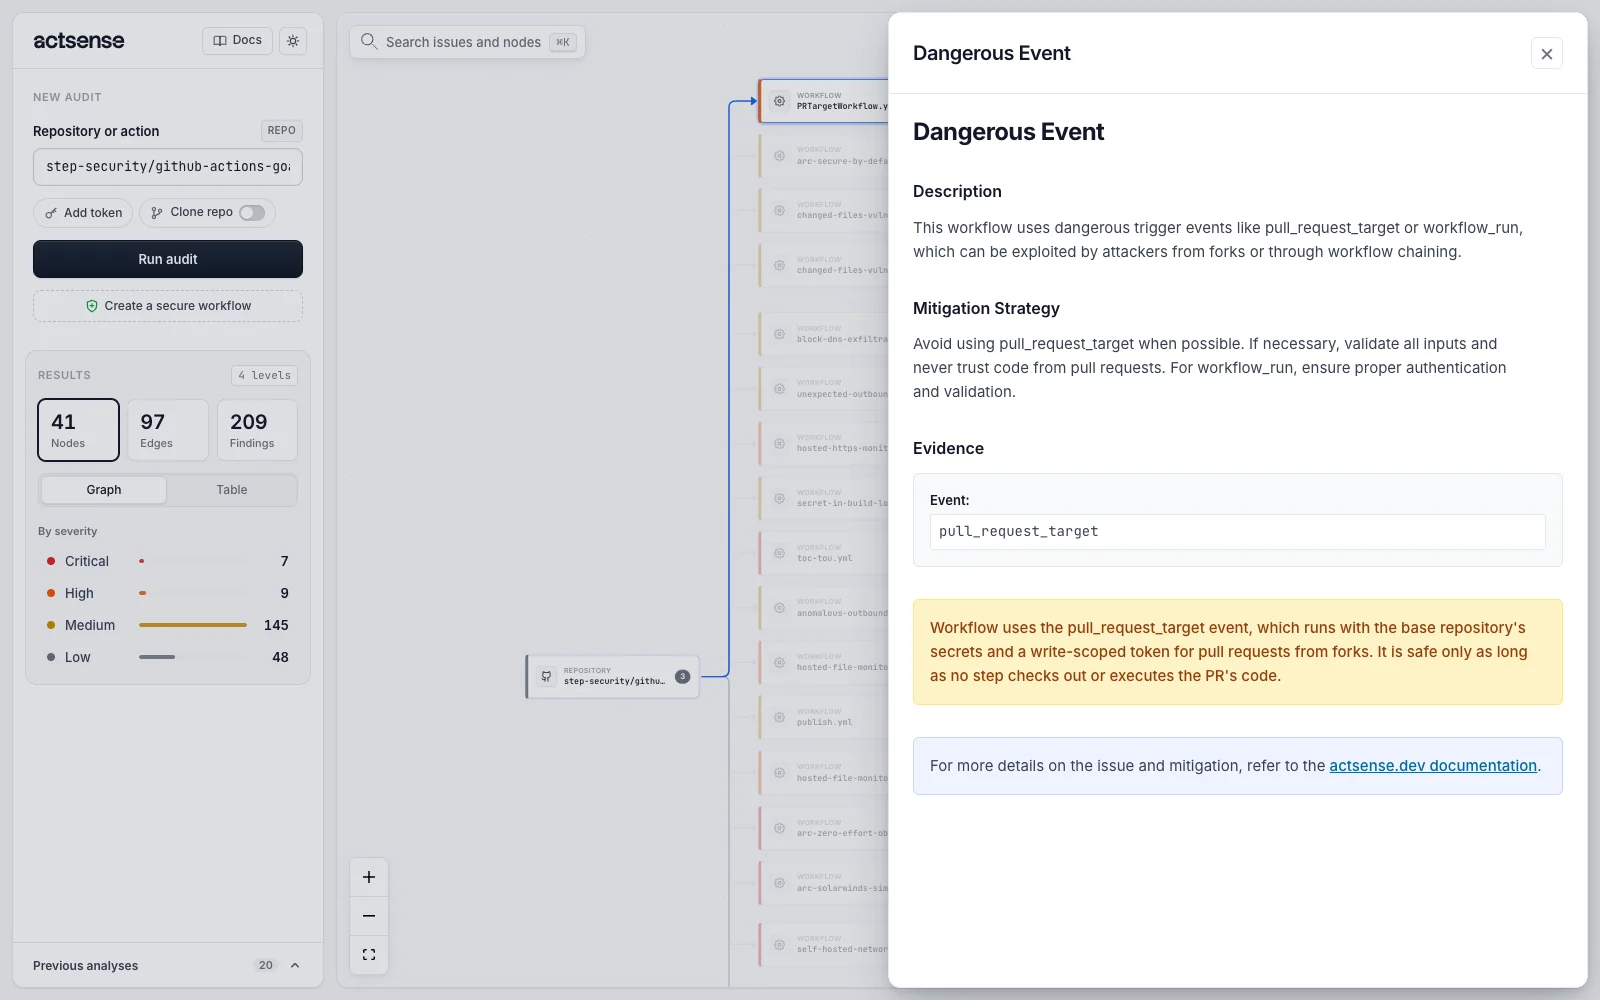
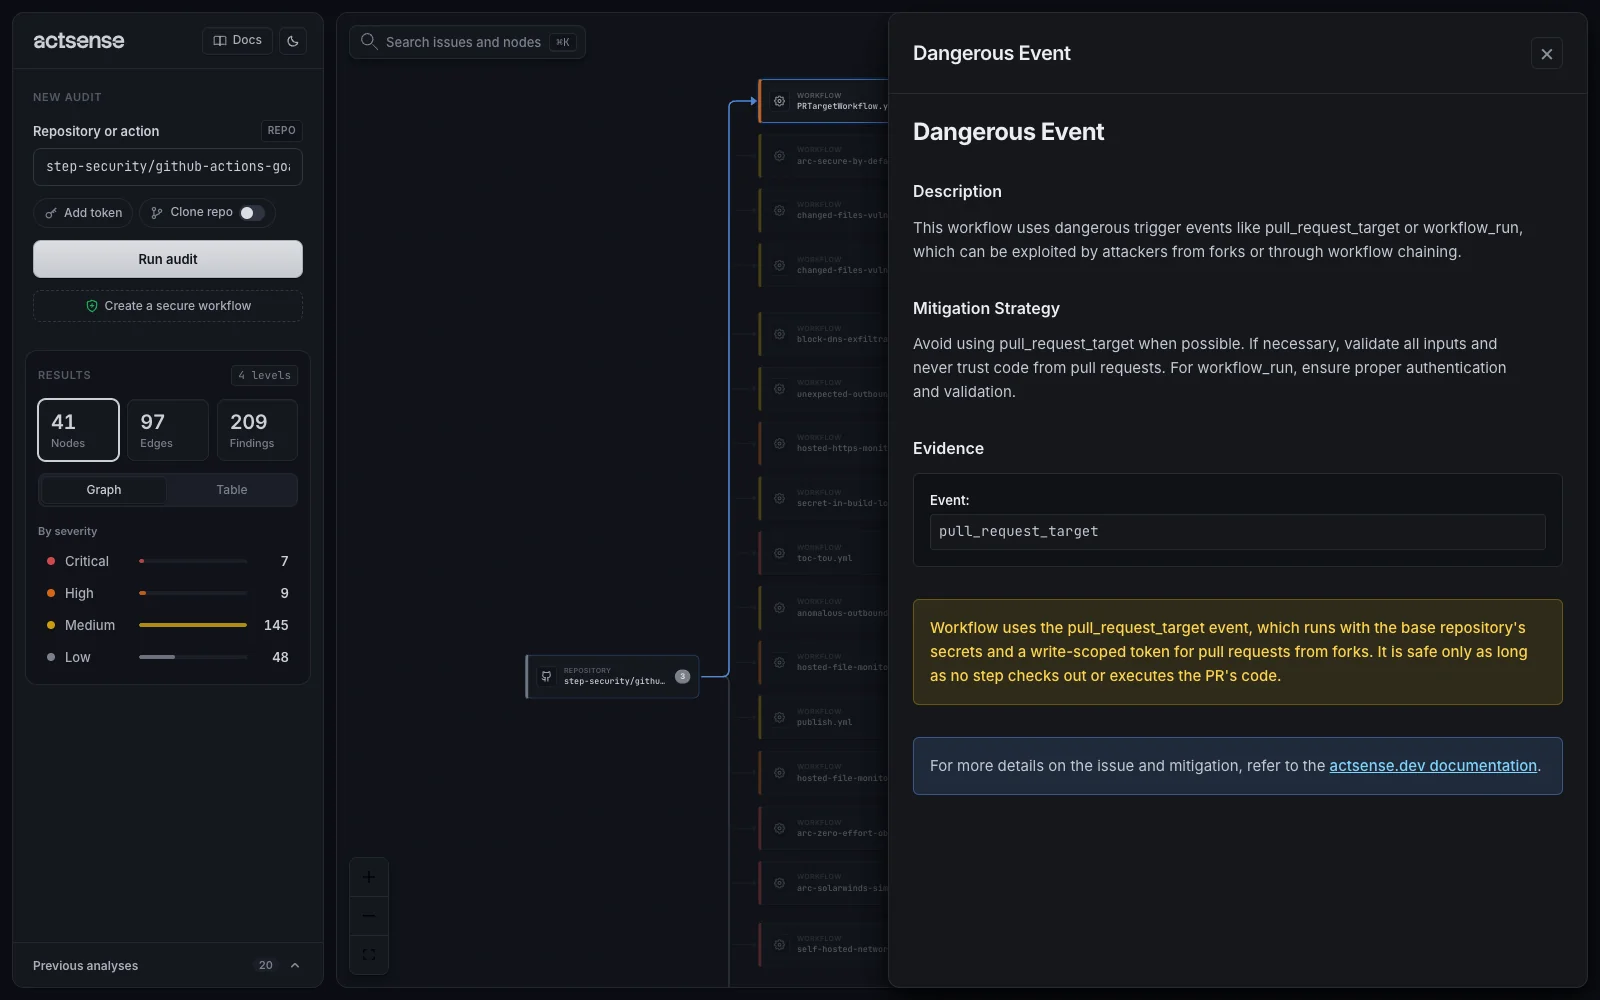
dangerous_event finding with the event that triggered it.Each finding explains the risk, gives a mitigation, and shows the evidence it was raised on: the event, step, line or value in the workflow. The link at the bottom opens that check’s page in the check reference.
Share a node
Share in the panel header creates a link to that node and its findings.
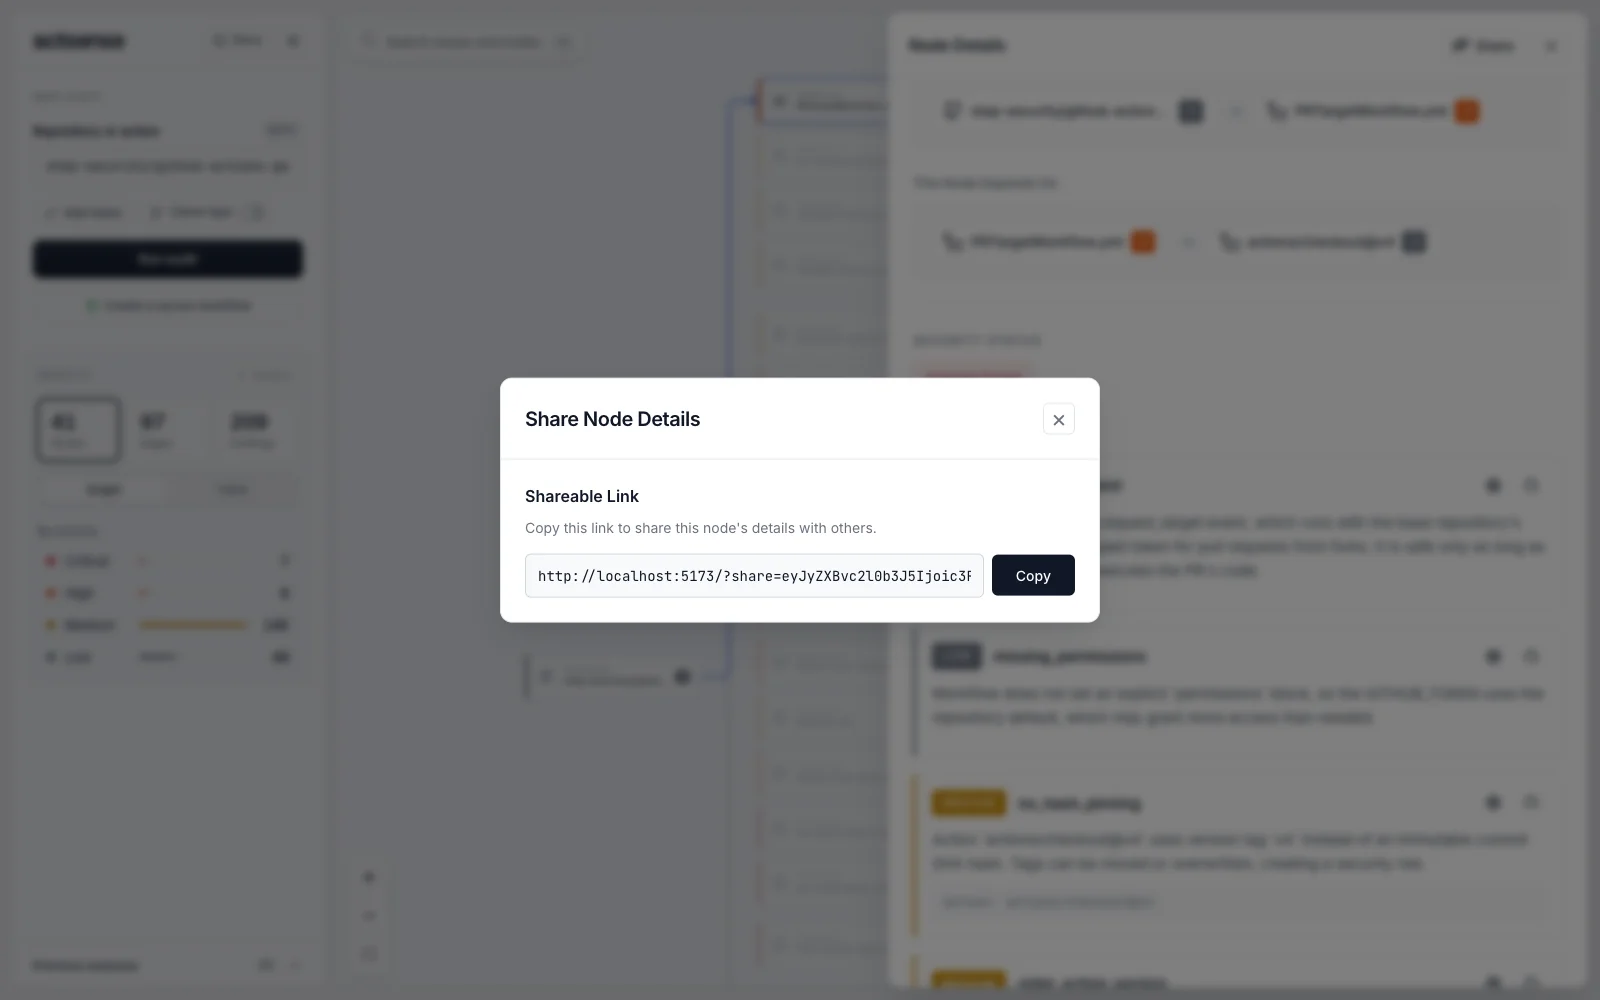
The node and its findings are encoded in the link itself, so nothing is stored on a server. Whoever opens it sees the same panel and can run the full audit from there.
Search and tables
Search
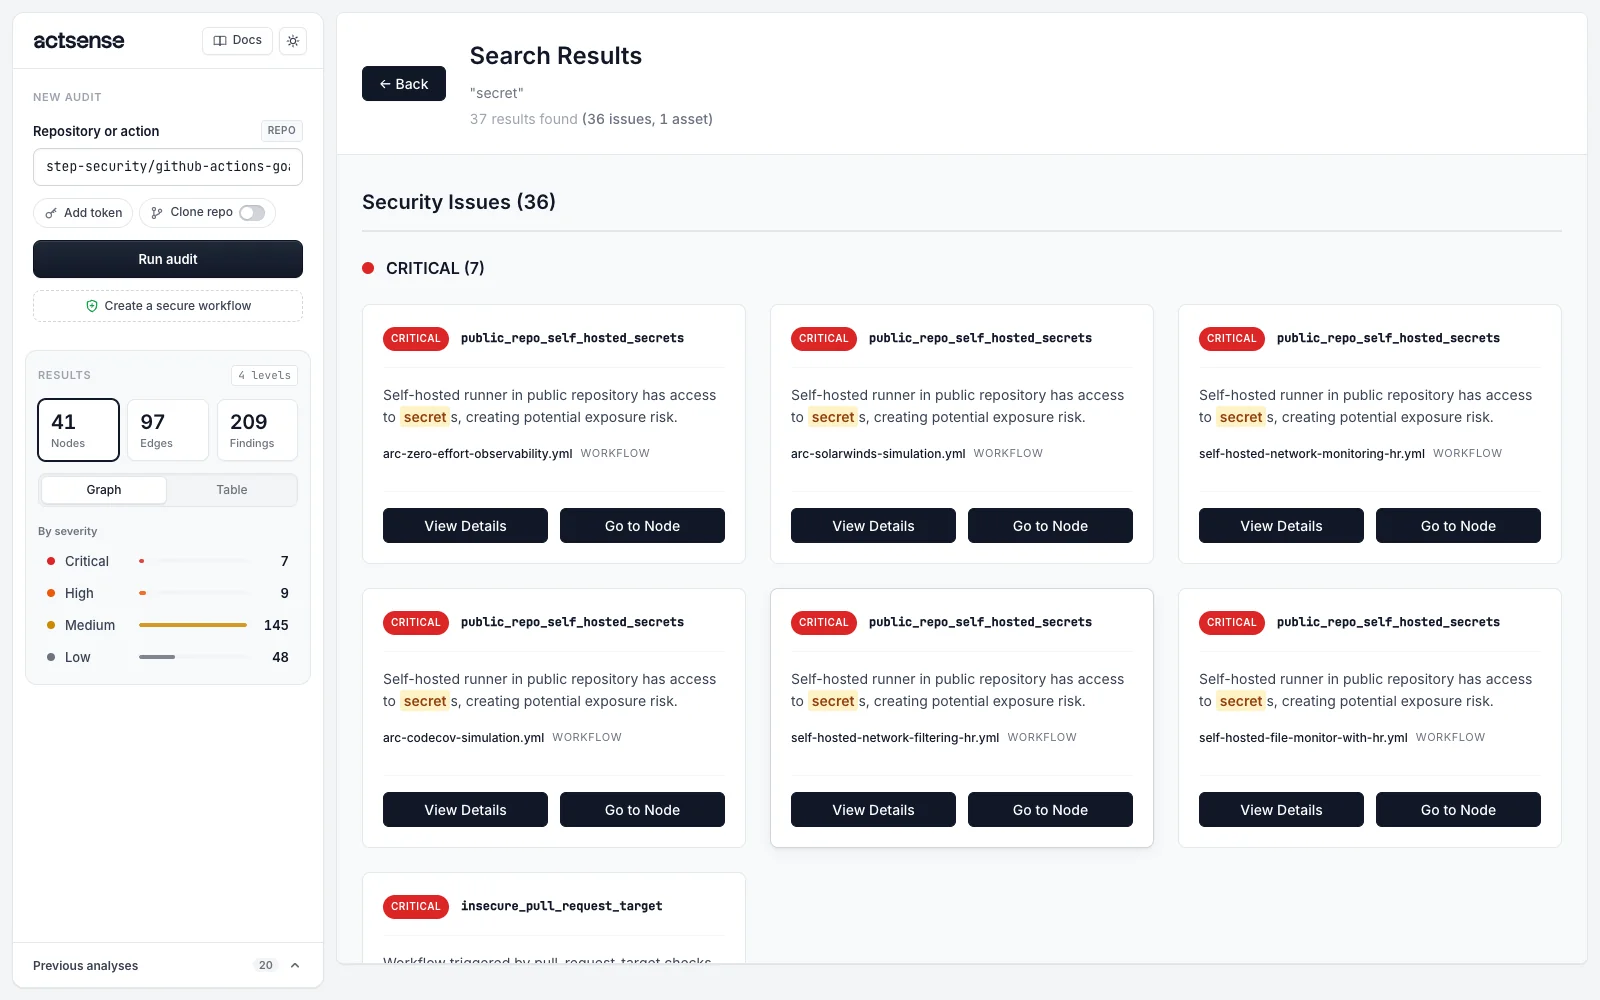
Press ⌘ K (Ctrl K on Windows and Linux), or click the search box above the graph. Search matches finding types, messages, node names, owners and paths.
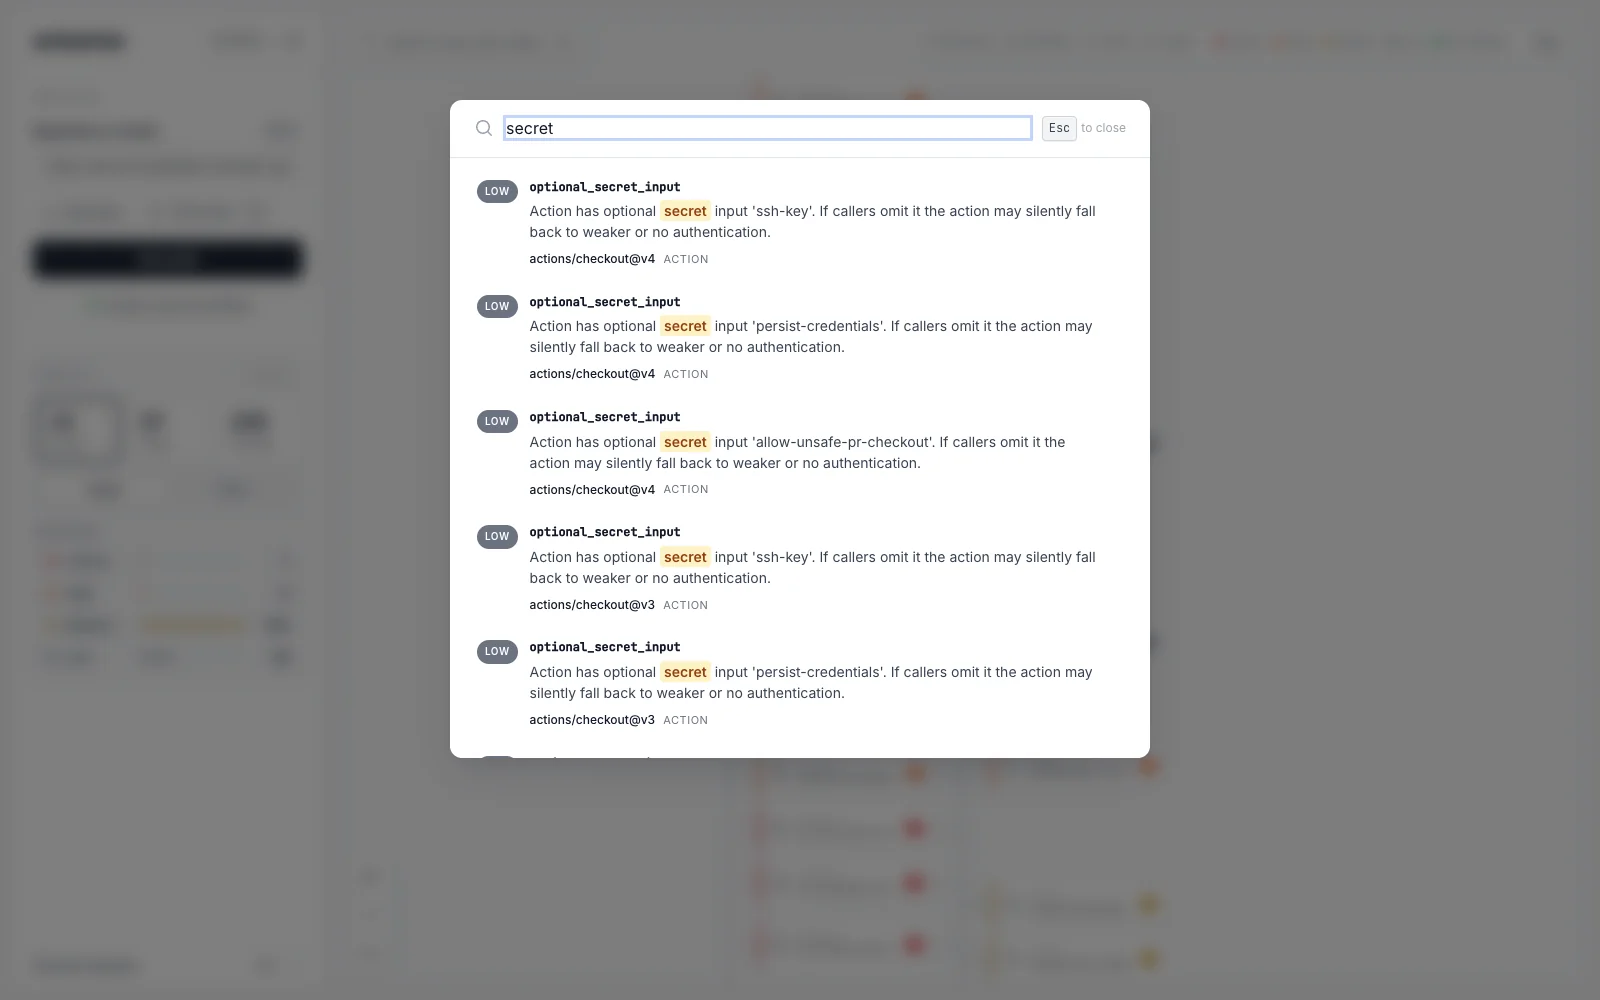
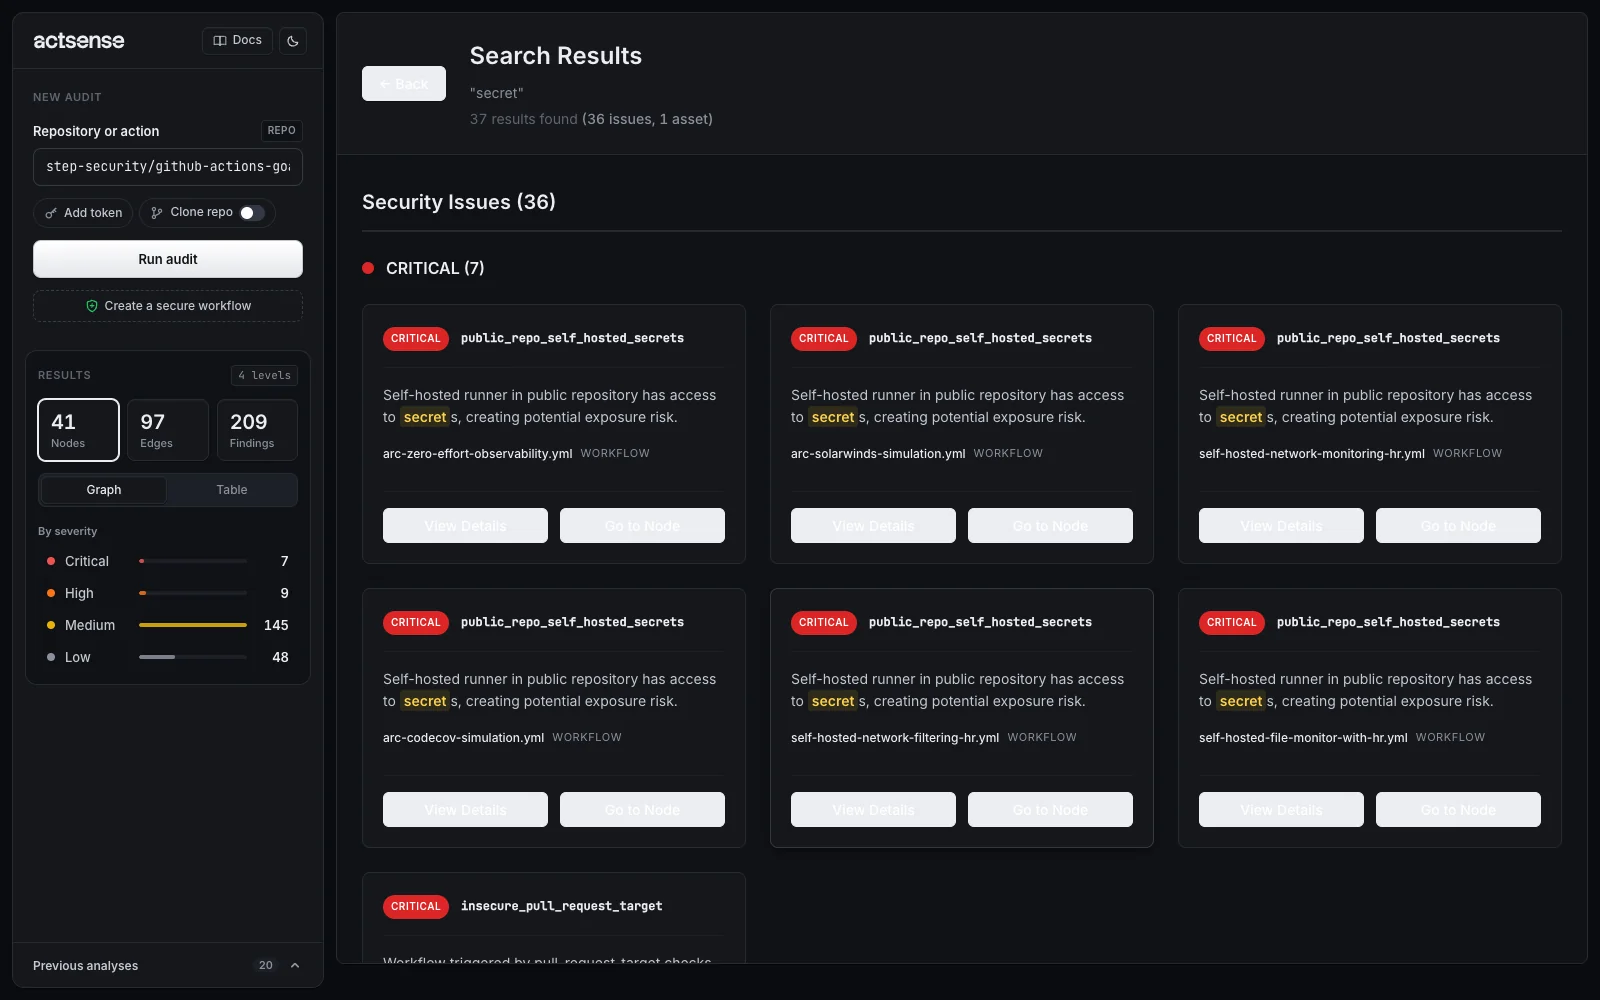
secret. Press Enter to open the top result.When there are more than eight matches, View all opens a results page grouped by severity. From there, View Details opens the finding and Go to Node shows it in the graph.
Findings table
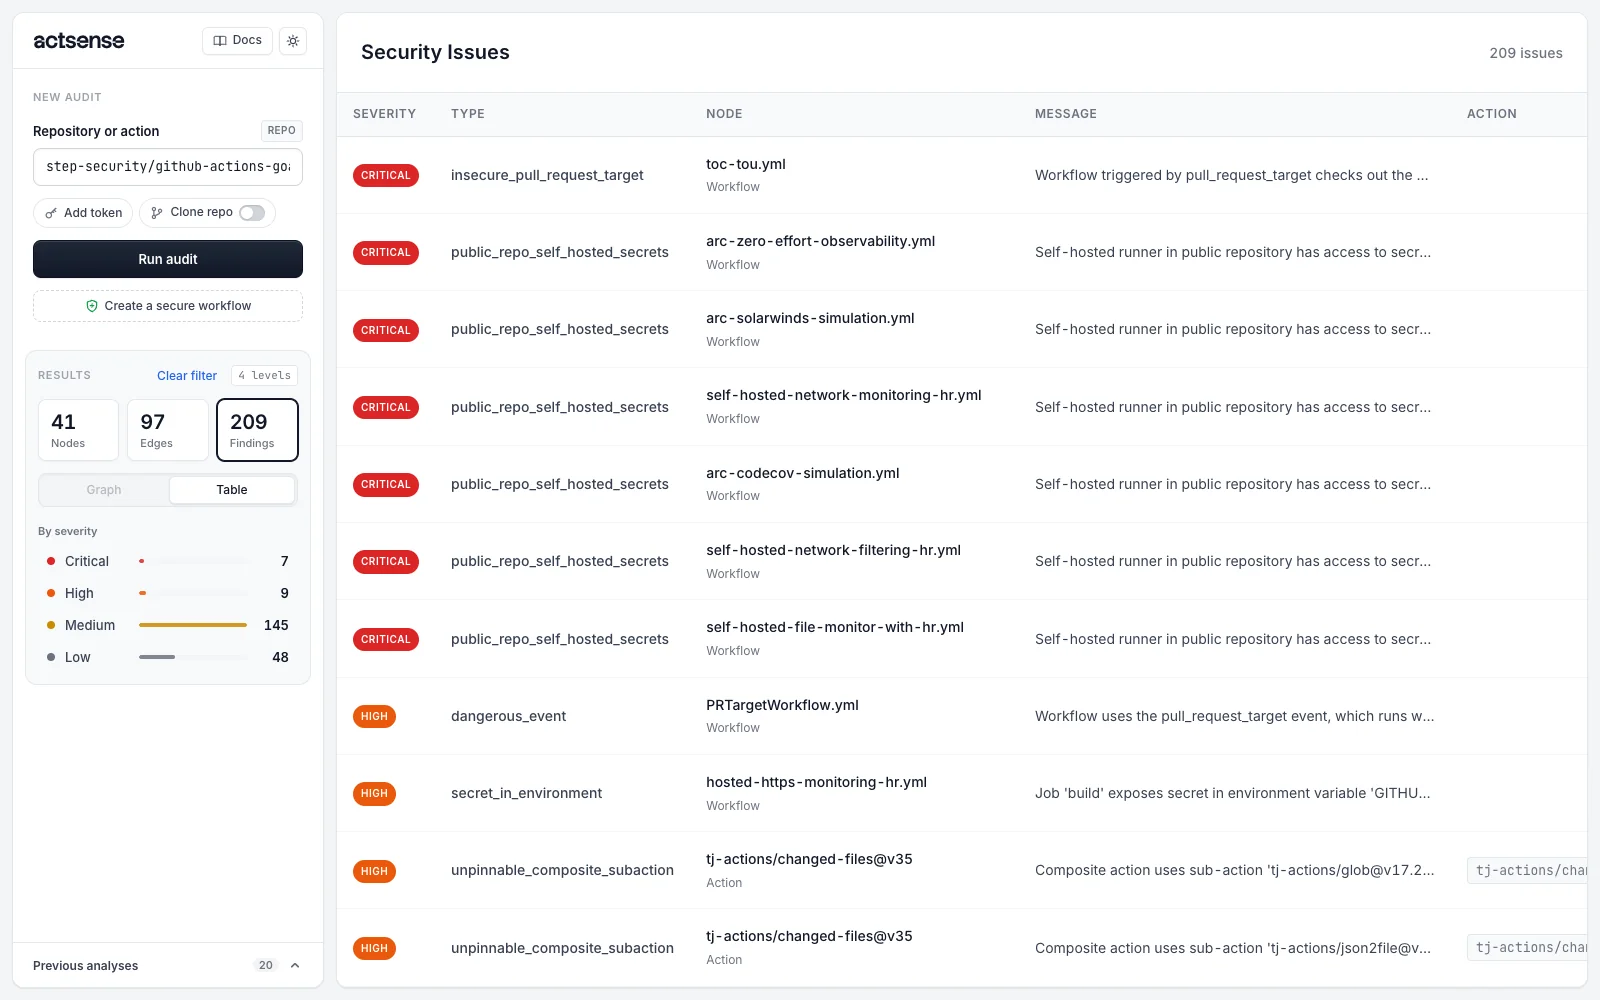
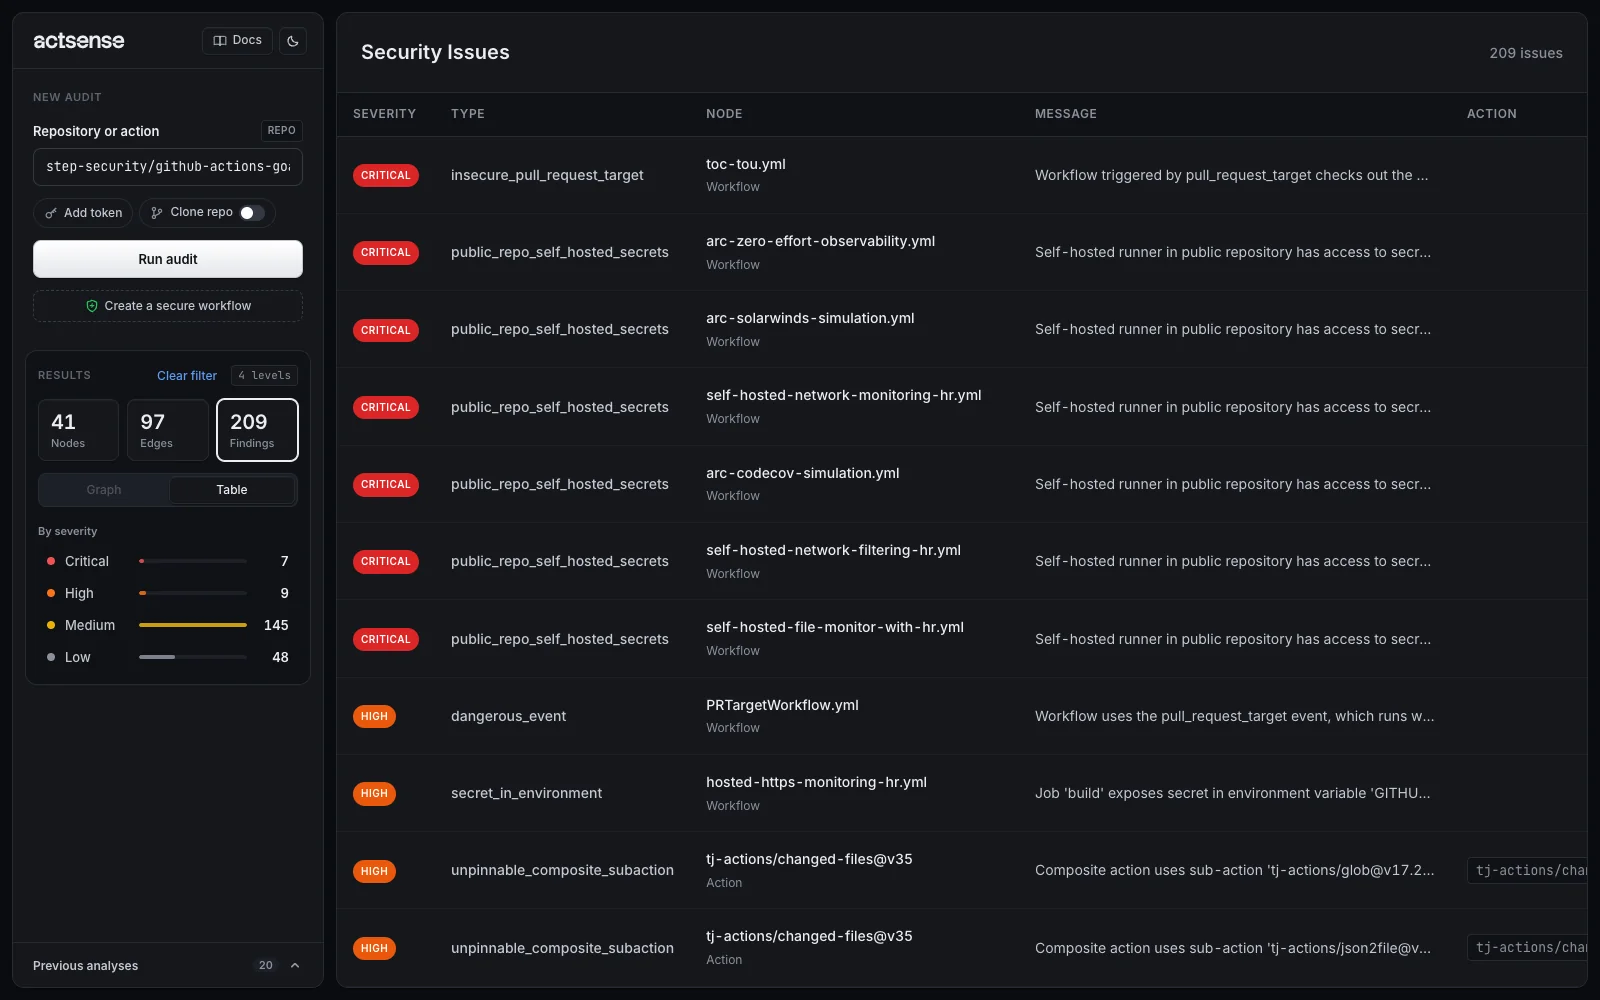
Select Findings in the sidebar to list every finding across the audit, critical first, with its node and message. Click a row to open the finding.
Dependency paths
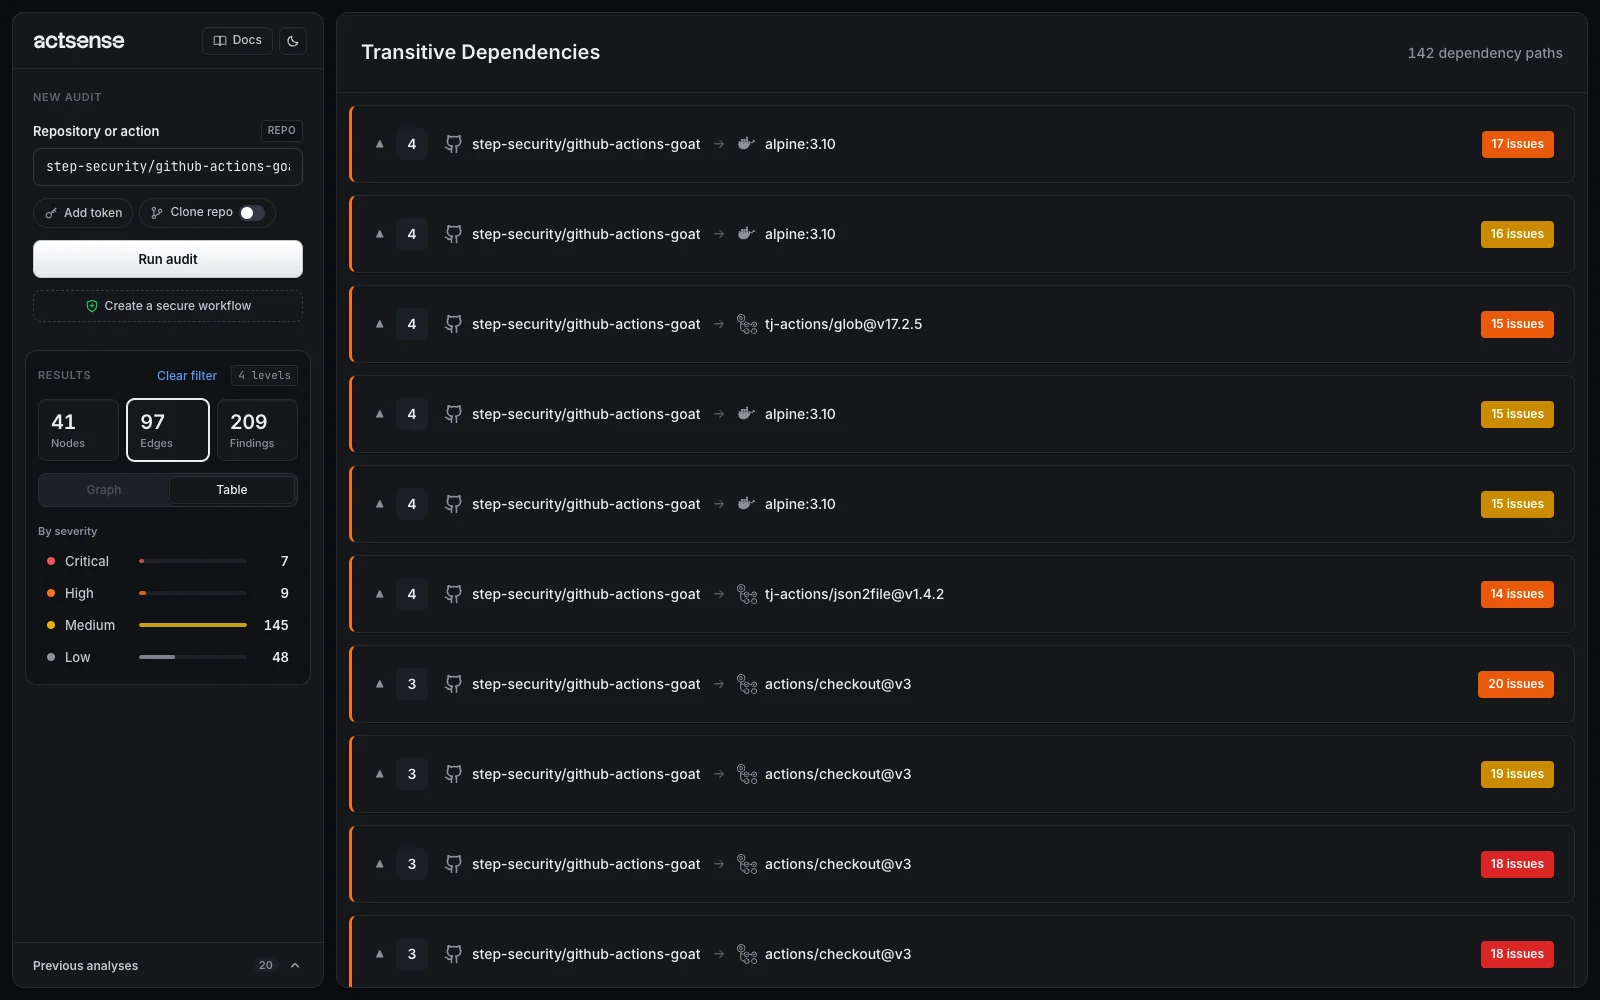
Select Edges to list every path from the repository to each dependency, with its depth and the number of findings along it. Expand a row to see each step of the chain.
Nodes table
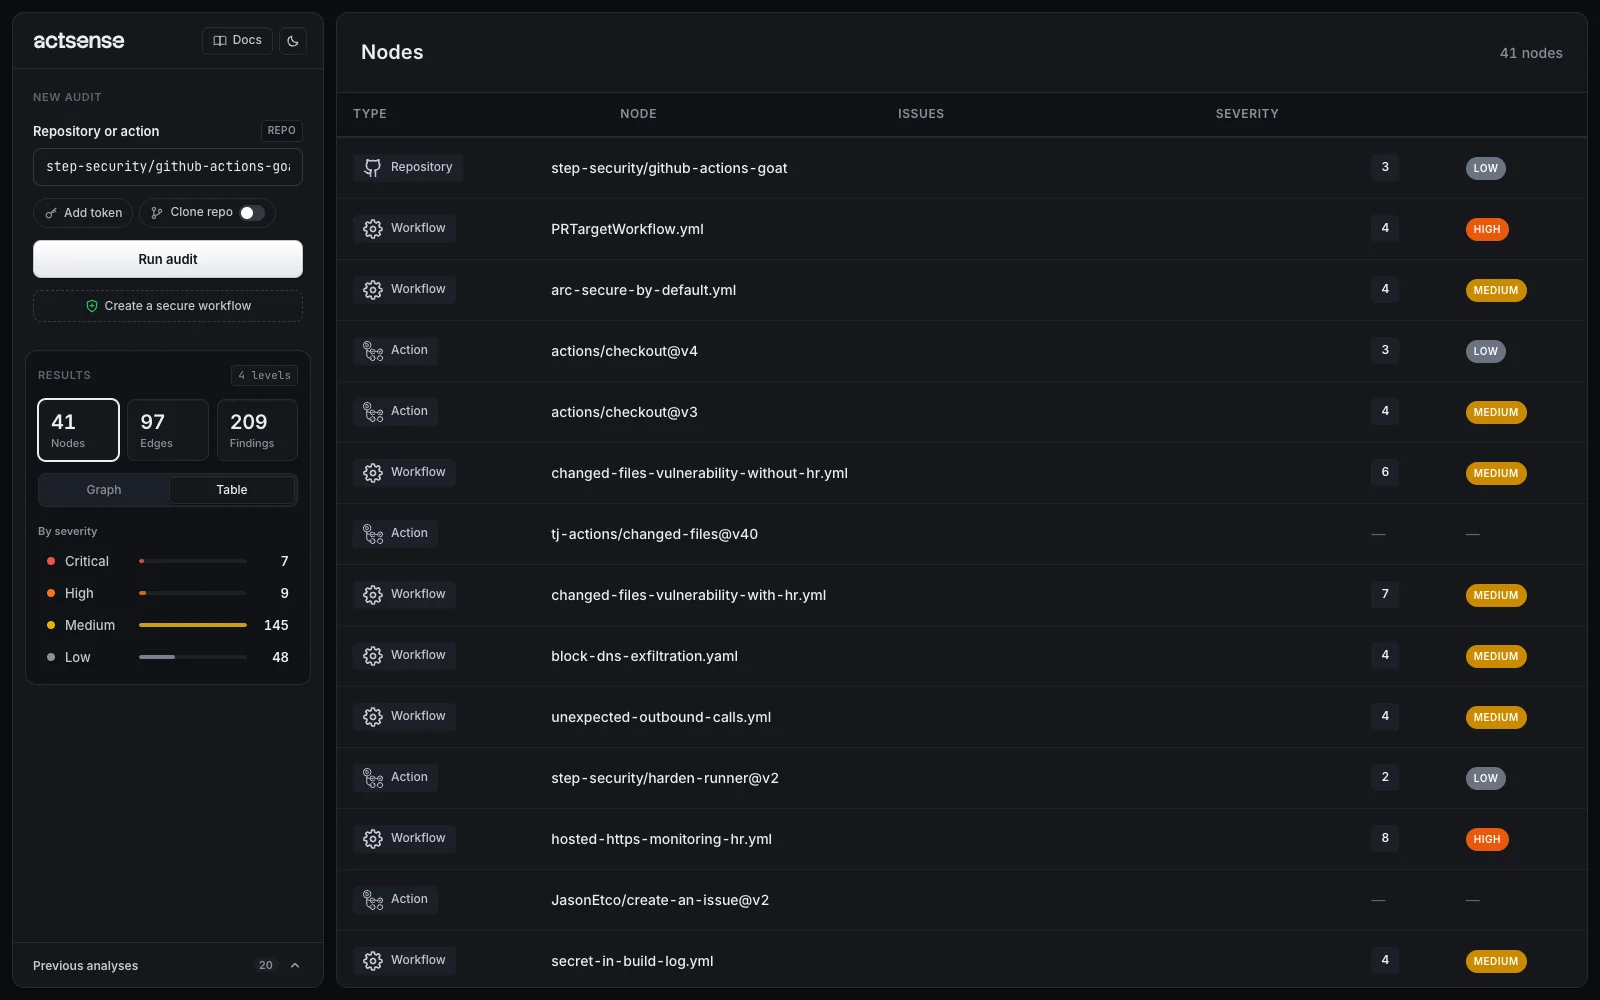
Switch to Table to list every node with its type, finding count and highest severity.
Fix a workflow
The secure workflow editor audits YAML you paste in, suggests line-level fixes, and applies them for you. Open it with Secure workflow on the start screen or Create a secure workflow in the sidebar.
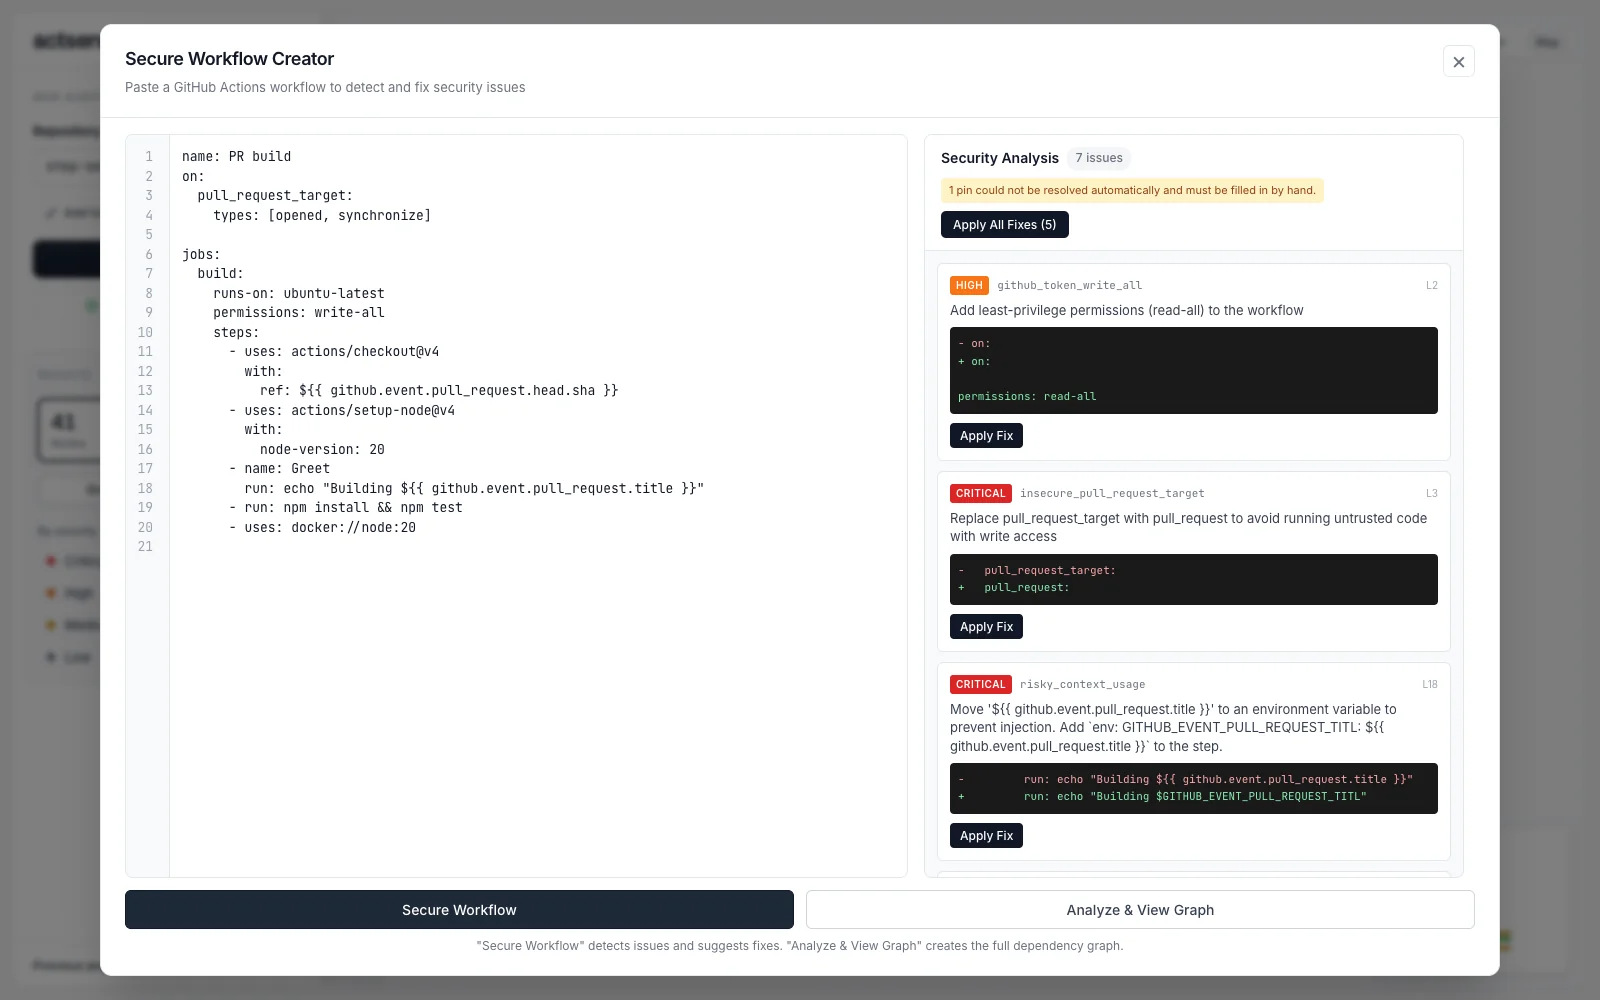
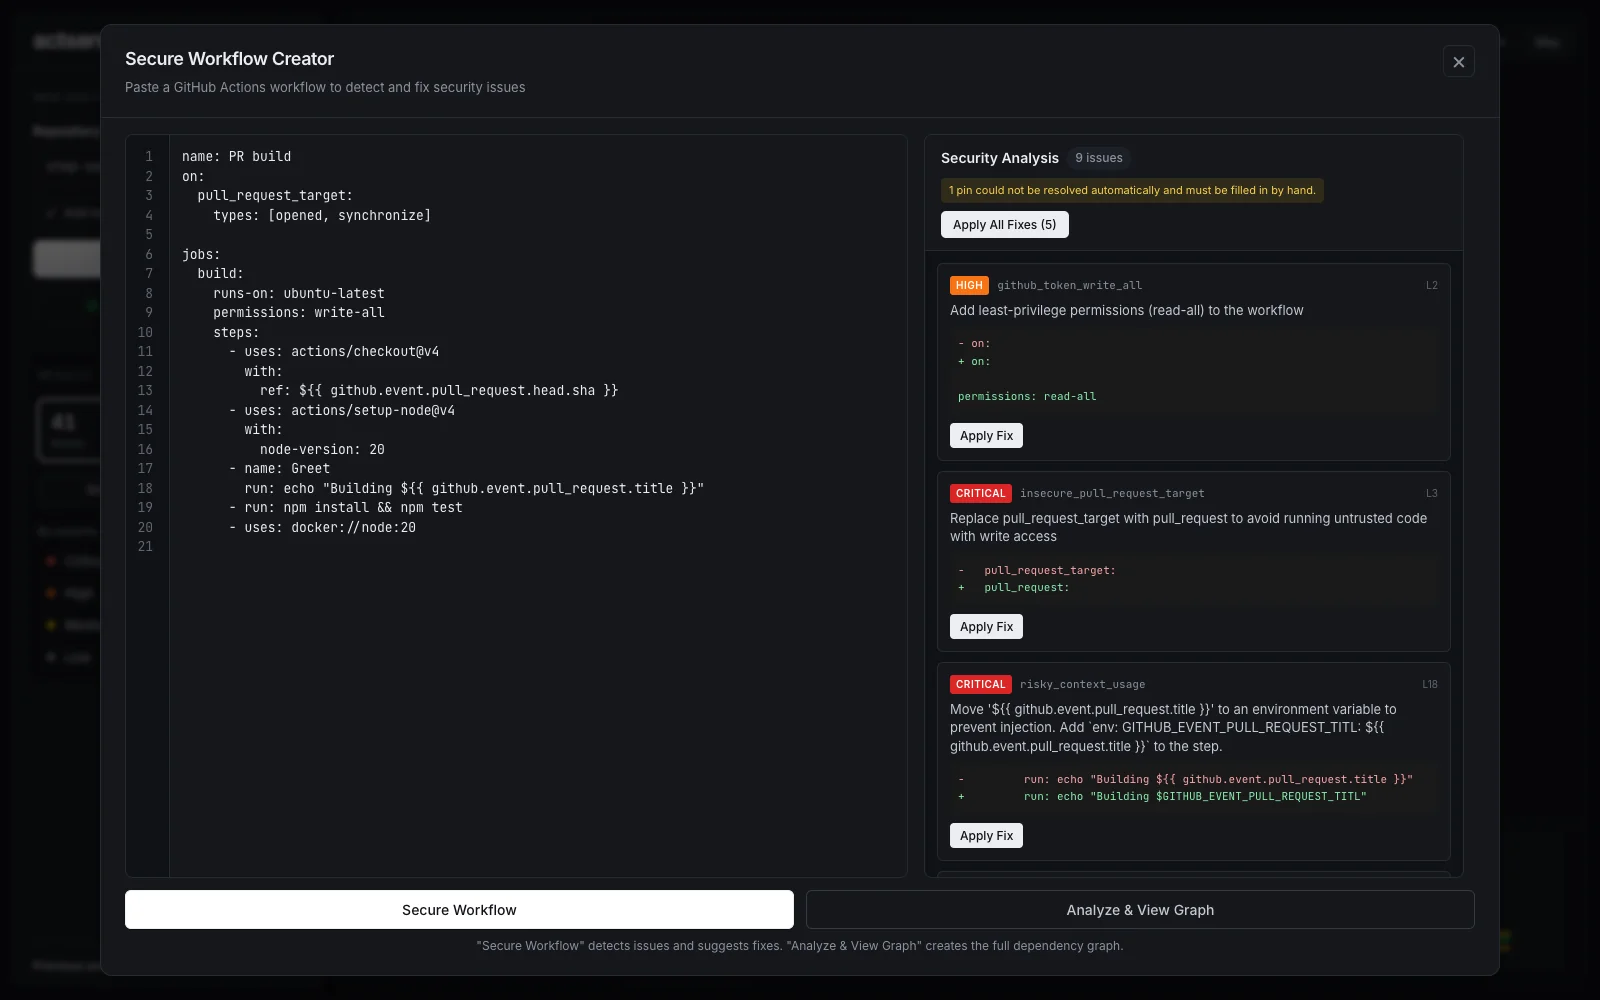
pull_request_target workflow, each with a fix you can apply.- 1
Paste a workflow
The YAML is validated first. Syntax errors and mixed tabs and spaces are reported with a line number.
- 2
Secure Workflow
Lists every finding with its line and, where one exists, a fix shown as a diff.
- 3
Apply fixes
Apply Fix changes one line. Apply All Fixes applies every automatic fix at once. Then run Secure Workflow again to check the result.
- 4
Analyze & View Graph
Runs the full audit on the edited workflow and opens its dependency graph.
Pinning fixes replace tags with commit SHAs and image tags with digests. They are resolved through pin., with the GitHub API as a fallback, so pinning works without a token. When a pin can’t be resolved, the fix is marked manual and contains a <SHA> or <digest> placeholder for you to fill in. Apply All Fixes skips these.
Good to know
The button next to Docs cycles between system, light and dark themes. Your choice is remembered in the browser.
actsense runs as one self-hosted container. Saved analyses live in its data directory, and tokens are never written to disk.
Everything the app does goes through the HTTP API. See the API reference to run audits from scripts or CI.
Each finding type has a page explaining the risk, a vulnerable example and a fix. Browse the checks.
docker run to your first audit.